d3fc-annotation
A collection of components for rendering plot area annotations (bands, crosshairs, gridlines and lines) onto Cartesian charts using SVG and canvas. |
 |
 |
 |
Main D3FC package
Installation
npm install @d3fc/d3fc-annotationAPI
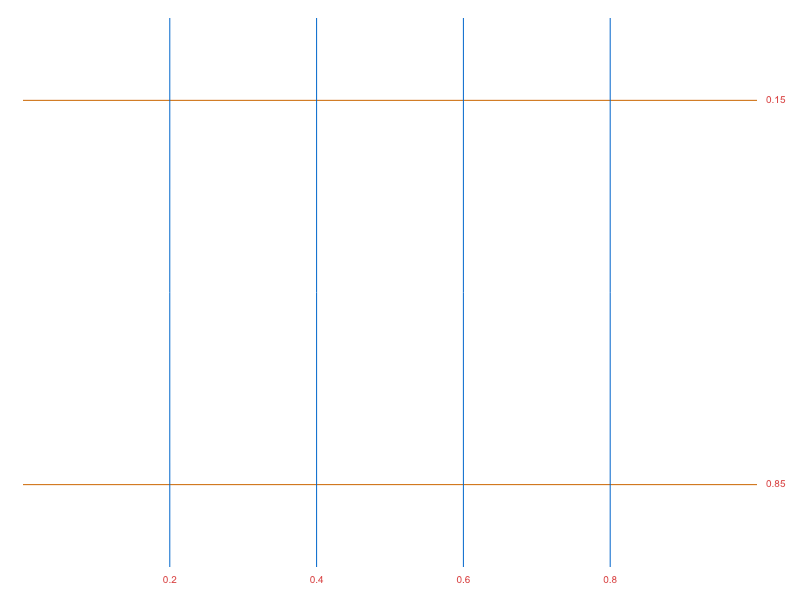
Gridline Annotation
The gridline component renders horizontal and vertical gridlines.SVG Rendering
# fc.annotationSvgGridline()Constructs a new SVG gridline annotation component. Once constructed, configure the component with scales and call it on a selection -
const xScale = d3.scaleLinear()
  .range([0, 100]);

const yScale = d3.scaleLinear()
  .range([0, 100]);

const gridline = fc.annotationSvgGridline()
  .xScale(xScale)
  .yScale(yScale);

d3.select('svg')
  .call(gridline);
Canvas Rendering
# fc.annotationCanvasGridline()Constructs a new canvas gridline annotation component. Once constructed, configure the component with scales and call it -
var ctx = canvas.getContext('2d');

const xScale = d3.scaleLinear()
  .range([0, 100]);

const yScale = d3.scaleLinear()
  .range([0, 100]);

const gridline = fc.annotationCanvasGridline()
  .xScale(xScale)
  .yScale(yScale)
  .context(ctx);

gridline();
Common Properties
# gridline.xScale(scale)If scale is specified, sets the scale used for the vertical gridline positions (combined with xTicks). Additionally, its range is taken as the bounds of the horizontal gridlines. If scale is not specified, returns the current xScale.
# gridline.yScale(scale)
If scale is specified, sets the scale used for the horizontal gridline positions (combined with yTicks). Additionally, its range is taken as the bounds of the vertical gridlines. If scale is not specified, returns the current yScale.
# gridline.xTicks(count)
# gridline.xTicks(interval)
If count is specified, sets the count passed to ticks when requesting the horizontal gridline positions when xScale is a continuous scale. For other scales, this value is ignored and the domain is used directly. If count is not specified, returns the current count.
When xScale is a time scale this method can be passed a time interval to specify the position of the gridlines. For example to generate gridlines every fifteen minutes:
gridline.xTicks(d3.timeMinute.every(15));# gridline.xTickValues(values)
Manually specify the vertical gridline positions. Overrides xTicks.
# gridline.yTicks(count)
# gridline.yTicks(interval)
If count is specified, sets the count passed to ticks when requesting the vertical gridline positions when yScale is a continuous scale. For other scales, this value is ignored and the domain is used directly. If count is not specified, returns the current count.
When yScale is a time scale this method can be passed a time interval to specify the position of the gridlines. For example to generate gridlines every fifteen minutes:
gridline.yTicks(d3.timeMinute.every(15));# gridline.yTickValues(args)
Manually specify the vertical gridline positions. Overrides yTicks.
# gridline.xDecorate(decorateFunc)
If decorateFunc is specified, sets the decorate function used when joining the vertical gridlines to SVG elements or drawing canvas gridlines. If not specified, returns the current decorate function.
# gridline.yDecorate(decorateFunc)
If decorateFunc is specified, sets the decorate function used when joining the horizontal gridlines to SVG elements or drawing canvas gridlines. If not specified, returns the current decorate function.
SVG Specific Properties
# svgGridline.xKey(keyFunc)If keyFunc is specified, sets the key function used when joining the vertical gridlines to SVG elements. If not specified, returns the current key function.
# svgGridline.yKey(keyFunc)
If keyFunc is specified, sets the key function used when joining the horizontal gridlines to SVG elements. If not specified, returns the current key function.
Canvas Specific Properties
# canvasGridline.context(ctx)If ctx is specified, sets the canvas context and returns this series. If ctx is not specified, returns the current context.
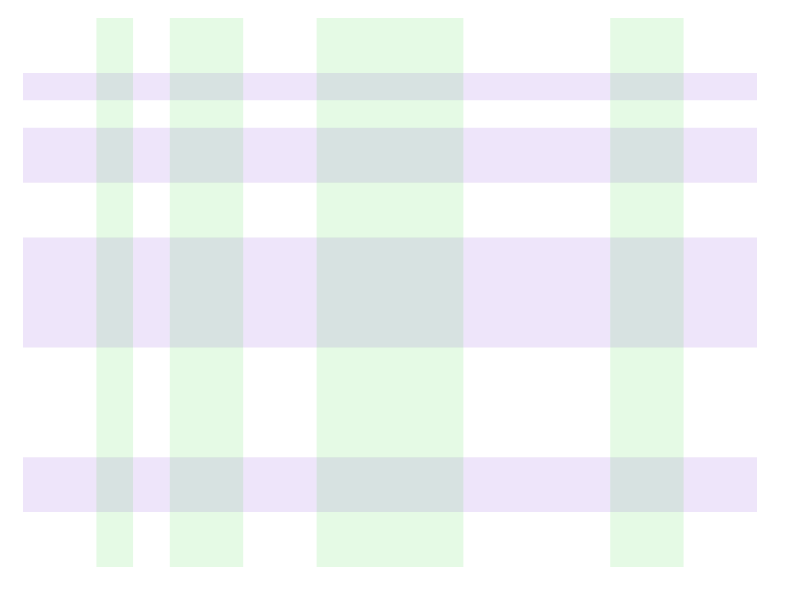
Band Annotation
The band component renders horizontal and vertical bands.SVG Rendering
# fc.annotationSvgBand()Constructs a new band annotation component. Once constructed, configure the component with scales, associate a selection with some data representing the band locations and call it on the selection -
const xScale = d3.scaleLinear()
  .range([0, 100]);

const yScale = d3.scaleLinear()
  .range([0, 100]);

const band = fc.annotationSvgBand()
  .xScale(xScale)
  .yScale(yScale);

d3.select('svg')
  .datum([{ from: 45, to: 55 }])
  .call(band);
Canvas Rendering
# fc.annotationCanvasBand()Constructs a new band annotation component. Once constructed, configure the component with scales and call with some data representing the band locations -
var ctx = canvas.getContext('2d');

const xScale = d3.scaleLinear()
  .range([0, 100]);

const yScale = d3.scaleLinear()
  .range([0, 100]);

const band = fc.annotationCanvasBand()
  .xScale(xScale)
  .yScale(yScale)
  .context(ctx);

band([{ from: 45, to: 55 }]);
Common Properties
# band.xScale(scale)If scale is specified, sets the scale used for transforming the fromValue/toValue positions of vertical bands. Additionally, its range is taken as the bounds of the horizontal bands. If scale is not specified, returns the current xScale.
# band.yScale(scale)
If scale is specified, sets the scale used for transforming the fromValue/toValue positions of horizontal bands. Additionally, its range is taken as the bounds of the vertical bands. If scale is not specified, returns the current yScale.
# band.orient(orientation)
If orientation is specified, sets the orientation of the bars to either
horizontal or vertical. If orientation is not specified, returns the current orientation.# band.fromValue(accessorFunc)
If accessorFunc is specified, sets the function used to retrieve the start value for bands. This value will be passed through the appropriate scale. If not specified, returns the current start value.
# band.toValue(accessorFunc)
If accessorFunc is specified, sets the function used to retrieve the end value for bands. This value will be passed through the appropriate scale. If not specified, returns the current end value.
# band.decorate(decorateFunc)
If decorateFunc is specified, sets the decorate function used when joining the bands to SVG elements or drawing the canvas. If not specified, returns the current decorate function.
Canvas Specific Properties
# canvasBand.context(ctx)If ctx is specified, sets the canvas context and returns this series. If ctx is not specified, returns the current context.
Line Annotation
The line component renders horizontal and vertical lines.SVG Rendering
# fc.annotationSvgLine()Constructs a new line annotation component. Once constructed, configure the component with scales, associate a selection with some data representing the line locations and call it on the selection -
const xScale = d3.scaleLinear()
  .range([0, 100]);

const yScale = d3.scaleLinear()
  .range([0, 100]);

const line = fc.annotationSvgLine()
  .xScale(xScale)
  .yScale(yScale);

d3.select('svg')
  .datum([50])
  .call(line);
Canvas Rendering
# fc.annotationCanvasLine()Constructs a new line annotation component. Once constructed, configure the component with scales and call it with some data representing the line locations -
var ctx = canvas.getContext('2d');

const xScale = d3.scaleLinear()
  .range([0, 100]);

const yScale = d3.scaleLinear()
  .range([0, 100]);

const line = fc.annotationCanvasLine()
  .xScale(xScale)
  .yScale(yScale)
  .context(ctx);

line([50]);
Shared Components
# line.xScale(scale)If scale is specified, sets the scale used for transforming the value of the line. Additionally, its range is taken as the bounds of the horizontal lines. If scale is not specified, returns the current xScale.
# line.yScale(scale)
If scale is specified, sets the scale used for transforming the value of the line. Additionally, its range is taken as the bounds of the vertical lines. If scale is not specified, returns the current yScale.
# line.orient(orientation)
If orientation is specified, sets the orientation of the lines to either
horizontal or vertical. If orientation is not specified, returns the current orientation.# line.value(accessorFunc)
If accessorFunc is specified, sets the function used to retrieve the value for lines. This value will be passed through the appropriate scale. If not specified, returns the current value.
# line.label(accessorFunc)
If accessorFunc is specified, sets the function used to retrieve the label for lines. If not specified, returns the current label.
# line.decorate(decorateFunc)
If decorateFunc is specified, sets the decorate function used when joining the lines to SVG elements or drawing the lines on the canvas. If not specified, returns the current decorate function.
Canvas Specific Properties
# canvasLine.context(ctx)If ctx is specified, sets the canvas context and returns this series. If ctx is not specified, returns the current context.
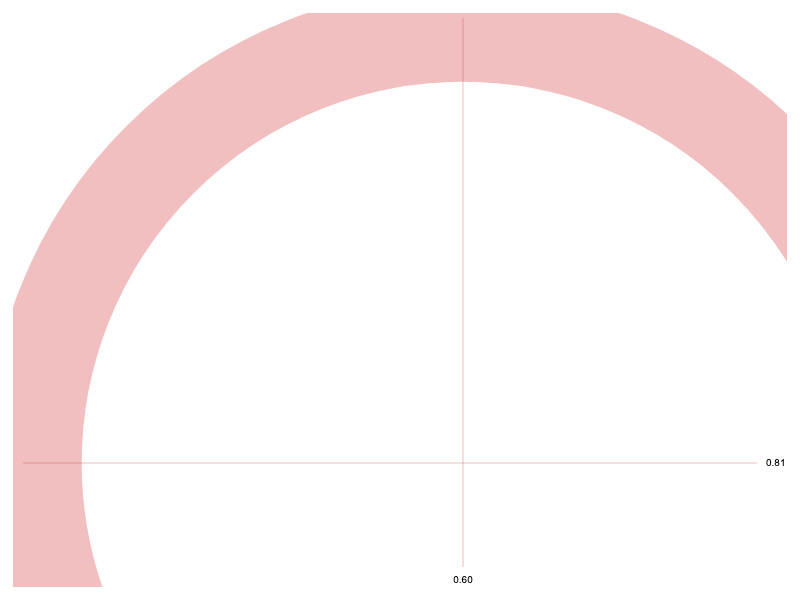
Crosshair Annotation
The crosshair component renders a pair of vertical and horizontal lines with a point at their center.SVG Rendering
# fc.annotationSvgCrosshair()Constructs a new crosshair annotation component. Once constructed, configure the component with scales, associate a selection with some data representing the crosshair locations and call it on the selection -
const xScale = d3.scaleLinear()
  .range([0, 100]);

const yScale = d3.scaleLinear()
  .range([0, 100]);

const crosshair = fc.annotationSvgCrosshair()
  .xScale(xScale)
  .yScale(yScale);

d3.select('svg')
  .datum([{x: 50, y: 50}])
  .call(crosshair);
Canvas Rendering
# fc.annotationCanvasCrosshair()Constructs a new crosshair annotation component. Once constructed, configure the component with scales and call with some data representing the crosshair locations -
var ctx = canvas.getContext('2d');

const xScale = d3.scaleLinear()
  .range([0, 100]);

const yScale = d3.scaleLinear()
  .range([0, 100]);

const crosshair = fc.annotationCanvasCrosshair()
  .xScale(xScale)
  .yScale(yScale)
  .context(ctx);

crosshair([{x: 50, y: 50}]);
Common Properties
# crosshair.xScale(scale)If scale is specified, sets the scale whose range is taken as the bounds of the horizontal lines. If scale is not specified, returns the current xScale.
# crosshair.yScale(scale)
If scale is specified, sets the scale whose range is taken as the bounds of the vertical lines. If scale is not specified, returns the current yScale.
# crosshair.x(accessorFunc)
If accessorFunc is specified, sets the function used to retrieve the x position of the crosshair. N.B. this value will not be passed through the appropriate scale. If not specified, returns the current value.
# crosshair.y(accessorFunc)
If accessorFunc is specified, sets the function used to retrieve the y position of the crosshair. N.B. this value will not be passed through the appropriate scale. If not specified, returns the current value.
# crosshair.xLabel(accessorFunc)
If accessorFunc is specified, sets the function used to retrieve the label for vertical lines. If not specified, returns the current label.
# crosshair.yLabel(accessorFunc)
If accessorFunc is specified, sets the function used to retrieve the label for horizontal lines. If not specified, returns the current label.
SVG Specific Properties
# svgCrosshair.decorate(decorateFunc)If decorateFunc is specified, sets the decorate function used when joining the crosshairs to SVG elements. If not specified, returns the current decorate function.
Canvas Specific Properties
# canvasCrosshair.decorate(decorateFunc)If decorateFunc is specified, sets the decorate function used when drawing the point of the crosshair. If not specified, returns the current decorate function.
# canvasCrosshair.xDecorate(decorateFunc)
If decorateFunc is specified, sets the decorate function used when drawing the vertical line of the crosshair. If not specified, returns the current decorate function.
# canvasCrosshair.yDecorate(decorateFunc)
If decorateFunc is specified, sets the decorate function used when drawing the horizontal line of the crosshair. If not specified, returns the current decorate function.
# canvasCrosshair.context(ctx)
If ctx is specified, sets the canvas context and returns this series. If ctx is not specified, returns the current context.